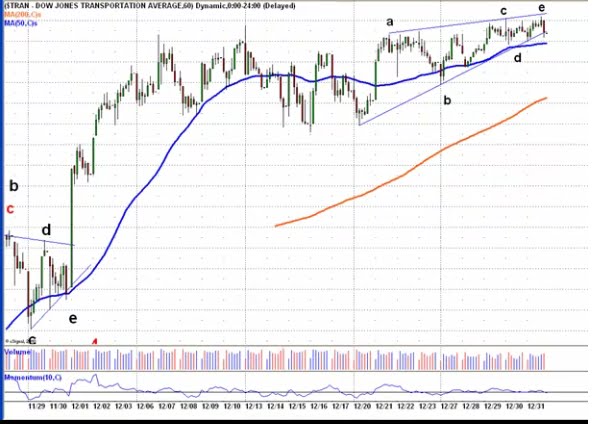
 Roy did up a special extended update this week-end with a look at Silver and the Dow Transports. He also has a lengthy introduction with a few longer-term comments about the markets and the total breakdown of paper money. To view this clip, Click here!!!
 If there was only one chart to pick that best tracked the SPX during 2010 it would go to this Neo-wave chart, I have had it in my public chart list for the last 18 months, and during 2010 there were very few changes made to the placements of red labels. It worked out well last year, so I will throw the dice and make my prediction for 2011 off of this chart and see if we can go for a double-or-nothing this year.
For many months I have had this laid out as a counter-trend triangle, and it played out just as planned. The SPX is now coming to the end of this current cycle in mid-January where both triangles become equal in terms of time, an important detail in Neo-wave forecasting, topping near a level of 1275 and finishing up the green "B" wave.
 So my prediction for 2011 after this green "B" wave wraps up, support drops down to 1150, where a break below here opens the door for a run towards 850 for the green "C" wave early in 2012. The larger structure is a basic contracting triangle that could last into 2013.
**Just for the record, I do not follow Glenn Neely's count nor am I affiliated with NEo-Wave in any form beyond Ad-sense that I have no control over which advertisers get displayed. This is my own interpretation of Neo-wave.
Just for the Perma-bears!!!
 Here is a long-term prediction that will surely please all the perma-bears. This is a worse case scenario if the above contracting triangle breaks down and gets voided. * A would like to take a moment and say a big THANK-YOU to everyone that has supported and followed along last year, without you I would of closed up shop long ago. 2011 looks to be an awesome year!!!
Donations are always welcomed!!


I think the next five years we will go through "hell"...if one studies history than it should be clear that we are experiencing "mass delusion" on an unprecented scale
ReplyDeleteOne possible scenario:
I see new lows in 2011 down to the 500s...then a rally to the 800s by year's end...and then a total collapse in 2012/2013 taking the S&P below 300...
Best wishes for the New Year! And thanks for your great work.
ReplyDeleteAgnes, possible, if this contracting triangle breaks down, the it becomes a VERY ugly long-term expanding triangle(the blue labels), with the green C, D, and E play out just as in EW, as the 3, 4, and 5th wave of blue C down. Think of the green A and B waves being waves 1-2 in this case!!!
ReplyDeleteThank-you 99er!!!
ReplyDeleteI hope your new year works out as the best so far :)
Michael
ReplyDeleteWhy don't you buy the EWI count of P1, P2, P3....?
We did have a clear impulsive wave down with P1, now P2 can only be seen as corrective, hence why not an impulsive P3 down?
By the way, I think this January will be of utter most importance...
ReplyDeleteIf we don't see a clear and dramatic impulse wave down...then I will see P3 as low probability scenario
agnes, I never said I do not buy EW's count, I just think that there are other possibilities worth looking at. On a very long-term time frame I also like the count that we are in wave 4 of 3 up still. the high back in 2000 being the 3 of 3 top. I have a long-term chart that goes back to the beginning of 1800, and I see another 1-2 that EWI does not count. Also when I apply the fib fans to this chart, it suggests the same count, that we are in a long-term 4th wave that started back in early 2000, maybe I will post that chart tomorrow :)
ReplyDeleteMichael
ReplyDeleteI think the biggest delusion is in....the BRICs story.
The BRIC story in magnitude is 10 times the dotcom story, since it affects the whole index worldwide
Stocks like BMW, BASF in Germany have gone parabolic because of "China"