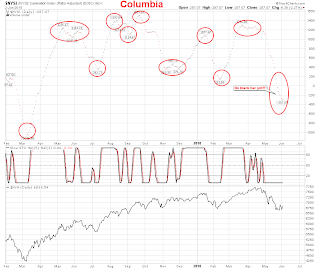
 The Summation Index put the brakes on hard after today's large bullish move, but still printed a red bar, still bearish.
 This count I posted earlier at 8:56 this morning played out really good today, now if tomorrow sells off hard, for the "e" wave down, we might have a good count going.
 After the close, Amazing, another 90+% up volume day. Something big is brewing when we keep getting these back to back 90+% volume days that we have witnessed over the last few weeks. This is a very rare occurrence mainly seen at important tops and bottoms and that normally only occur a couple times a year. Suddenly we have had multiple days of 10:1 volume, the Market might be trying to tell us something historic is about to happen.
When the market does break out of this trading range and establishes its long term trend, this could be an event of a life time. Now, if only Mr. Market would say which way it will be before hand.
Both, Bullish and Bearish options are still valid, and until it does break-out, the trend remains neutral. I did simplify the bearish count on the chart above, eliminating the triple zig-zag, and replacing it with a simple A-B-C label, for the 2nd wave up. And there are still no one squiggle, or micro-count that is standing out as having high probabilities to be correct, just too many different ways to count what we have now, to have much faith in just one count. BTW, Cash is a position.
Breadth for the day ended at 4.75:1, advancers, on a day where buy volume accounted for 94.74% of the total volume. By itself, this volume would be an incredible number, but with it starting to happen with such frequency, it is only somewhat bullish. LOL!!!
One day soon, we are going to get back-to-back days with these huge numbers going the same direction, and that would really help to figure out what the longer term trend will become. Until then, we still have two levels to watch for higher highs, and lower lows, 1119.03, and 1065.59.
 12:10, the short-term trendline of support on the VIX has broke, and if the low of 29.39 gets taken out, I would expect the VIX to continue falling to fill all those gaps, resulting in a bullish condition for the indexes!!!
 8:56, Here is another count I have been watching, and with the move up today it gives this option some possibility.
Current Breadth is running 3.61, advancers, on 88.43% buy volume, if the markets close at these levels yesterday's bearish move would be invalidated.
 Click here for a live, and updated chart!!!
8:17, There are no short-term bullish Fib fans, just two bearish fans for now with last resistance around the 1090 level.
 Click here for a live, and updated chart!!!
7:55, There are still no squiggle, or micro counts that I have much confidence in, so at this point the trendlines and other forms of TA become more important until the counts clear up, and we start producing some impulsive waves that stop over-lapping.


All those visiting pl. visit our chat room at the bottom of the page. Lots of goodies.
ReplyDeleteMike, have any idea on a wave count at this point? Today has been very confusing on what this market wants to do. Thanks!
ReplyDeleteBTW: I opened up a PayPal account and I will donate to you once I get some $$$ in it. You are doing a GREAT job and I want to thank you for it. :-)
Thanks Kim, at this point, I do not see any micro-count that has good odds, or that I have high confidence in :)
ReplyDeleteLove that summation index Mike. I've been reading some articles that suggest that the history in the making to which you allude is going to be very disappointing to anyone long just about anything.
ReplyDelete