 Just when you thought it was safe, here is another count that I have been watching, a leading diaganol that could really throw the bears for a loop, bulls too!!!.
I was not happy with the original LD idea because it never looked right, but this one has the look of a correct LD, with a sharp 2nd wave, and complex, flat 4th wave. Downside target would be 973.13 MAX, because the 5th wave can not be longer then the 3rd in a contracting triangle. It is something to be aware of if we get another strong sell-off, that reverses course right in the middle of what most people will believe to be a 3rd wave down. Notice the possibility of a head and shoulder for the 2nd wave up?
 After the close, That 1106 area is really proving itself as a tough area of resistance, again the SPX was turned away before it was able to test the 200 day MA at 1108.24, that was the fourth attempt to break above that level. The trend is still neutral, and although we did make a higher high, it was VERY brief and was immediately turned back. Before moving the longer-term trend to bullish, I would like to see a higher high made with conviction.
The waves on the SPX continue to over-lap and in the larger picture are very corrective, with no channels yet being formed. This can go on as long as the waves keep morphing into more complex corrective waves, and still see no way to count this rally as an impulsive wave, but unfortunately, this corrective wave can retrace almost all the way back to the top. We still have not reached the 38% retracement level at 1110. (50% level is at 1130, and the 62% is at 1152).
Breadth for the day ended at 1.61:1, advancers, that is a little spooky, a Fib number!!!
Important levels for tomorrow are 1085.67, from the support of the 20 day MA, follow by 1052.25, the next lower low. On the top-side, we still need to break above the resistance of the 200 day MA to get to close that gap up at the 1115 area.
 Click here for a live, and updated chart!!!
7:58, There is now only one fan line left for the bears that will provide resistance, around the 1110-1115 level.
 7:50, The VIX has broke down, and is now making lower lows, as the trend continues to be down. There are still four gaps to be filled, not what the bears what to see.
 The Daily chart of the SPX is now full-blown bullish, with only the 200 day MA for near-term resistance. The 31/24 day has crossed, and printed a bullish bar in the Histogram at the top of the chart. The MACD, also has crossed, and is tending upwards, as well as the STO on the RSI. The only bearish thing on this chart is the declining volume, but we all remember last year where the markets forged ahead on decreasing volume.
 Click here for a live, and updated chart!!!
7:37, The RSI on the 15 minute chart is peaking in over-bought territory, we should get a sell-off here soon, and the size of that sell-off will help determine the future direction on the trend.
 Click here for a live, and updated chart!!!
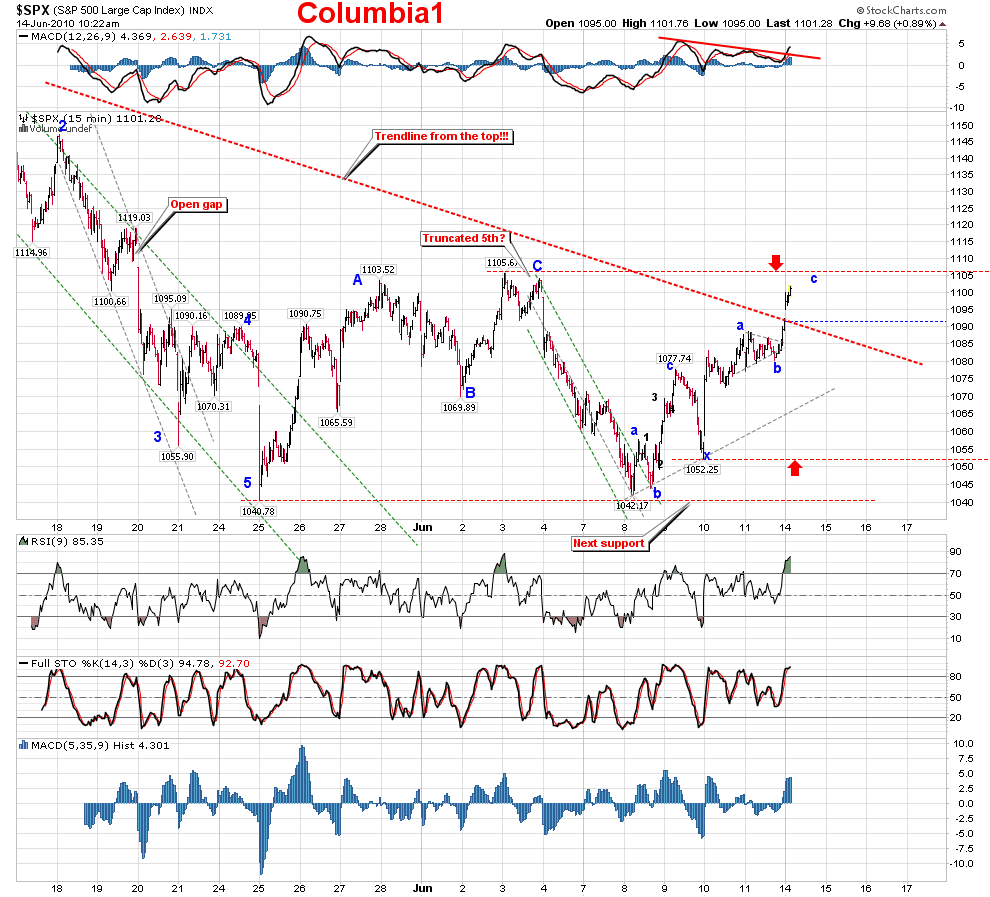
What little chance there was for the 1-2, 1-2, 1-2, down count is gone, leaving two main options, the sell-off was completed in a leading diaganol, with the SPX having a truncated 5th wave, and now we are in the 2nd wave up, or a really bullish option, where the entire sell-off was a corrective wave, with new highs to come. I have been warning for the last few days the TA was going bullish, but the move up looks more corrective in nature, then impulsive, leaving the first option ( 2nd wave up) the most likely in terms of probabilities.
In just another blow to the bears, the SPX took out the trendline from the highs, adding more evidence that a bottom was put in.


Hi colombia
ReplyDeleteMy thought for tuesday
Hi traders,
My thought for tuesday.
Test EMA200 and close below friday close. Wasn`t a good close but bears need to close hourly below 1077.
Key suport short-term range [1077,1082]. Close below 1077 expect 1065 possible extension to 1050.
Stochastic overbought conditions Rsi testing lower band neutral zone.
Blue Trendline tuesday (15/06) sitting 1098.05
Resistance Key area [1100,1106].
Resistance Key level 1115 reversal trend short-term
Key level dowside 1077
Chart here http://3.bp.blogspot.com/_MJqKtyMMr28/TBaTSqkDEuI/AAAAAAAACC8/AmnDJUaT1ws/s1600/spx+15062010.png
Chart 2 http://4.bp.blogspot.com/_MJqKtyMMr28/TBaTpcSQIHI/AAAAAAAACDA/t7BkjqQlRN0/s1600/spx1+15062010.png
All update here with last weekly and monthly thought
http://followmarketrend.blogspot.com/2010/06/spx-daily-market-thought-15062010.html
Have a nice week and good luck for tuesday.