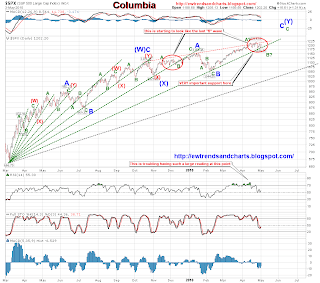
 After the close, Again no follow through to Friday's large sell-off, instead we got a 1.31% gain for the day and the long-term trendline from 666 is still holding as support. This situation is starting to become eerily familiar to the sideways correction we saw back in November, stuck in a tight trading range that lasted slightly longer then one month. We have been in a trading range now for the last three weeks, of 1180 to 1220. Needless to say, the trend remains neutral until we start making some higher highs, or lower lows. Both the bullish and bearish counts are still valid, but with some waves that require some fancy work to make them count as impulsive, especially in the bearish count, where Friday's sell-off is really tough to put an impulsive count on it, but where a double zig-zag, corrective wave fits much fine.
Breadth for the day was 3.64:1, advancers, which is a respectable bullish move, and not one that would support a bearish outlook. But, again, until we get some follow-thru to these numbers for more then a day or two it is pointless to use just one days worth of data to try and figure out what the direction of the trend will be.
Levels to watch are still the 1175 area, and 1220 for higher highs, and lower lows. Also that trendline from 666 should be watched, as a break-below could signal that a large sell-off has finally got some legs to it.
 Click here for a live, and updated chart!!!
7:59, I have enough data now to put a short-term bearish fan on the 15 minute chart.


No comments:
Post a Comment