Chat-room!!!!!!!

Live Blog Chat-room 2
 
Showing posts with label Hindenburg Omen. Show all posts

Thursday, August 19, 2010

After the close, A Confirmed Hindenburg Omen???

After consolidating for a couple of days, the Summation Index headed back in its original direction printing a red bar that is accelerating to the downside
2:19, If the 10 week MA is rising, then we do have a CONFIRMED Hindenburg Omen!!!

The McClellan Oscillator did close below zero, this does qualify, as did the required amount of new highs and lows(more about this down below).

On a long-term chart of the SPX, the 20 and 50 week Moving Averages are very close to crossing, and if the bulls do not have an extreme rally ASAP, the three major Moving Averages will be back into a bearish alignment for the long-term trend. This is bearish for a lot of long-term investors. Notice that the 50 week MA acted as resistance for the last mini-rally that stopped just shy of 1103, now there will be two MA's that will provide resistance before the SPX can make a minor higher high.

The bigger picture of the SPX could really have the market collapsing if this current count holds true, there are only two decent spots of support from previous lows before a test of the 1010.91 low comes into play and all the major MA are resistance. With tomorrow being OPEX, anything is possible, and large moves are normal, this is the bulls last chance before what little support that is left, falls apart.

Things went from boring yesterday to exciting today as the SPX wiped out most the gains made from the previous three days, all in a few short hours taking out the pieces of support it had built along the way. The SPX is once again below all the major Moving Averages on both the daily, and weekly charts, with first resistance now coming from the 50 day MA at 1089.37, all on strong sell volume. The SPX did have one more of those really bearish days that help set trends with 91.42% of the total volume coming from the bears.
One big piece of news after the close is that a second signal for the Hindenburg Omen might of been triggered. The WSJ is reporting 147 new 52 week highs, and 75 new lows and Stockcharts is reporting 113, and 70, both sources qualify. The McClellan Oscillator still needs to be below zero when Stockcharts gets their charts updated. The fly in the ointment is the 10 week MA of the NYSE, that looks flat-lined and in my chart is too hard to tell if it is declining or advancing, if it is advancing then we DO have a second signal, and that would make the Hindenburg Omen a confirmed Omen.
I added the short-term count 1-2 down, although it is very possible today was a 3-4, it all depends on where the top is at and if that was really a 1-2 yesterday that had a 99% retracement, or a truncated wave that never did make a higher high.
Breadth for the day ended at 4.41:1, decliners, on very bearish sell volume, this is definitely a warning sign for the bulls, because if we have follow-thru tomorrow that exceeds these numbers, 1010.91 is quickly on the table.
The SPX did make a minor lower low, keeping that trend down, and is very close now to making a major lower low if 1069.49 gets taken out, and the Trend Finder closed at 75% bearish.
You can find intra-day charts and analysis down below in the next post.

Tuesday, August 17, 2010

Tuesday updates

I found this article tonight at EWI, and since I have been posting alot on the Hindenburg Omen, I thought I would pass this along!!!

The Hindenburg Omen – “Omen-ous” or Not?
EWI Chief Market Analyst Steve Hochberg Sheds Light on this Technical Indicator
By Michael McNeilly
Tue, 17 Aug 2010 15:15:00 ET

Last week's volatile market action coincided with a technical signal called the Hindenburg Omen whereby a relatively high number of new highs and lows in individual stocks occur at the same time.
This indicator instantly gained an enormous amount of media attention. I thought it might be of interest to readers so I sat down with Steve Hochberg, EWI's Chief Market Analyst to get his unique perspective and insight.

Michael McNeilly: Steve, recently a market indicator called the Hindenburg Omen has been in the news, what is going on?
Steve Hochberg: Discussion of this indicator certainly has been everywhere. Someone emailed us and said they even saw it mentioned on the front page of the Drudge Report! Look, headline-grabbing names grab headlines. Essentially it measures the fractured nature of market action. Over the years, we've discussed numerous times in our publications how a fractured market is oftentimes an unhealthy market. The multiple non-confirmations registered at the recent August 9 stock high, which we talked about in The Short Term Update, are another manifestation of this bearish behavior. The message is consistent with how we view the Elliott wave structure.

MM: Why are people interested in this particular indicator?
SH: That's a good question, and it speaks to a broader issue, viz., the "re-emergence" of technical analysis into the mainstream consciousness of market participants. In Prechter's Perspective, Robert Prechter discusses the timing of the popularity of technical analysis, of which Elliott waves, or pattern recognition, is the highest form:

"In long term bull markets, no one really needs market timing because the market is always going up. This was true during the 1950s and 1960s, a period of market strength. And it has been mostly true since 1982. From 1966 to 1982, though, the market was very cyclic, so investors couldn't sleep like babies with a buy-and-hold blanket like they do today."

The S&P 500 has a negative return over at least the past 12 years, so investors are naturally questioning the "broadly diversified, buy and hold" stance advocated by 90%+ of investment advisors. EWI subscribers are way ahead of the mass of investors because as the bear market progresses, the media should show increased focus on technical analysis, including patterns such as head-and-shoulders as well as trendlines, moving averages and, yes, even Elliott waves, just as they did during the last great bear market from 1966 to 1982. It will be an exciting time for those with even a cursory knowledge of the "technicals."

MM: So, what are you seeing now?
SH: Obviously we cannot give away our analysis, but the wave structure is clear, the myriad indicators we keep offer compelling confirmation and the market is accommodating our forecast. If readers have any interest in what this means for not only the stock market, but also all other markets, please give us a read to see if our work might be useful in helping to formulate your investment portfolio. We think it will be a worthwhile endeavor. Click here for more info!!!


The Summation Index threw the bears a curve today, printing a black bar, and putting the down trend in serious jeoperdy. It takes more then one bar reversing to signal a new trend, but is a big warning sign, if the SI continues to print black bars that start accelerating to the top-side we will be in a new up-trend
The VIX which has been a thorn in the sides on the bears, and the bulls best hope, is approaching support of the 200 day MA. The indicators on this chart are mixed, as they are on many daily charts today, with the MACD bullish, and the STO bearish. The RSI seems neutral on most charts, with a slight bullish look to it.
After the close, The SPX has now retraced back to the 50% level, and in a three wave move that can be counted as a simple a-b-c. It is very possible that it has reached the end of this small-uptrend if the bearish count is correct, and this 2nd wave does not morph into a complex correction, that is, an a-b-c-x-a-b-c. One option that is really on my mind, is that since we only have three waves up, this also can be counted as a 1-2-3 up, with the 4th and 5th wave still to come to finish the "A" wave of 2 up. A break below 1082.62 would invalidate this option as the 4th wave would enter the price territory of the 1st. A break below 1075.16 would be the best sign that a top is indeed in, and the SPX is heading towards making important lower lows.
The short-term trend is neutral, as is the Trend finder so tomorrow will be an important day that could decide the longer term trend. Right now the indicators are equally divided with the short-term ones bullish, and the longer term ones bearish. It is when the longer-term indicators start turning bullish that the Trend Finder will follow through with bullish reading, however, since it is the short-term indicators that are bullish, they can turn much faster to bearish, then the longer-term bearish readings can turn bullish.
Breadth closed the day at 3.77:1, advancers on improved volume over yesterday's weakest volume of the year readings.
On the Hindenburg Omen, after the close there were 203, 52 week new highs, with 17 new lows, WAY out of the range now for a signal to get triggered, the SPX needs a good sell-off tomorrow and then it might have a change to get that second signal in.
For tomorrow, a break above today's high of 1100.14 gives the SPX a good chance to run up and fill that gap at 1115-1120 which would be a very bullish move to have that gap closed, and puts 1131 in play. And the bears need a break below 1075.16 to keep the longer term trend pointed down.
Click here for a live, and updated chart!!!
8:54, The bulls have the ball and are running with it, if the bears cannot get control back ASAP, a lot of resistance is going to turn to support, and the idea of the SPX in a 1-2, 1-2 down will be thrown out the window. The SPX has escaped the clutches of the bearish Fib fan this morning opening the doors for another test of the 1131 area.
another alarming piece of news for the bears is that breadth is currently running slightly below 6:1, advancers, this a strong!!!
8:39, The SPX has cleared one hurdle, the 50 day MA and is now heading upwards towards a full chunk of resistance, including the 20 day at 1105.08, the 200 day at 1116.07, and two different trendlines in the 1115 area. The MACD is sell on a full sell, but the RSI, and STO are both on buys, with the STO in over-sold territory.
8:20, The SPX has passed the 38% retracement level and now is heading towards the 50% level making a minor higher high in the process, moving the short-term trend to neutral as well as the Trend Finder going neutral at 8:00 am.
Click here for a live, and updated chart!!!
7:30, The SPX behaved as expected this morning with a gap up to fill the old gap from August 12th and is now close to wrapping up the "C" wave of 2 up. The next spot of resistance on this chart is 1093.94 from a previous high or the iv of 3, of 1, down high, a spot that is very common for a 2nd wave to retrace to. A break below 1075.16 would most likely signal that the 2nd wave up has been completed.

Monday, August 16, 2010

Monday updates

Yields on US Treasuries had another ugly day!!!
The Summation Index continues to print red bars, suggesting the longer-term trend remains down. I am adding a link to this chart, along with some others in my spare time to the upper-right hand corner of the blog, thank-you for the suggestion!!!
On the weekly chart of the SPX, the 20 week, and 50 week Moving averages are very close to crossing over, this is a sign that long-term investors use in determining the long-term trend, and is one of the most basic forms of Technical Analysis.
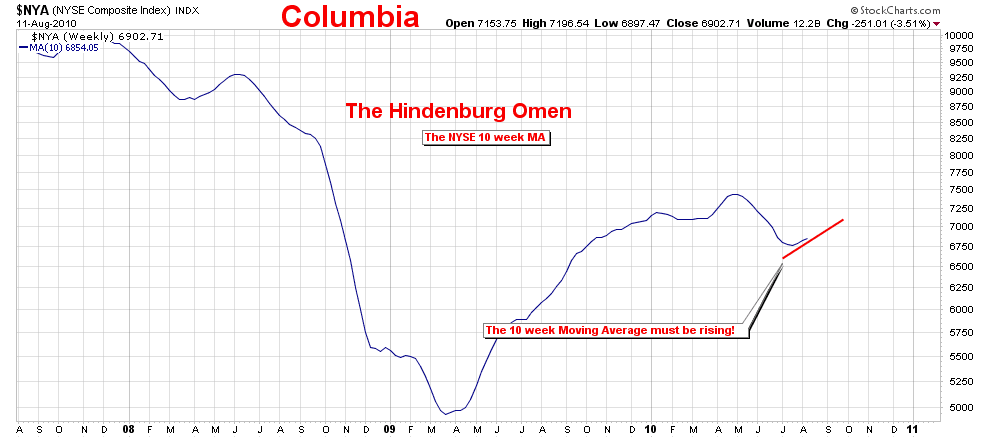
An important update on the Hindenburg Omen, the 10 week moving average has now shifted to a down-trend, and as long as it stays in that down-trend we can have no more signals. Currently the MA is at 6855.56, this morning the reading was at 6855.64, see note on chart.
After the close, the SPX looks to have finished its 5th wave down right after the open, and is currently tracing out a 2nd wave correction, which if it stays simple would be a sharp a-b-c, but things have not been so simple lately so I half expect this 2nd wave to morph into a complex correction, maybe a double zig-zag, a-b-c-x-a-b-c. The first point for a target would be that open gap between 1087-89 which also happens to be where the first point of resistance lays in the form of the 50 day MA, currently at 1087.49, and surprisingly, if it does turn into a simple correction, wave "C" would equal the length of wave "A", at 1088.29. 1092.28 is the 38% retracement level for the sell-off, and at 1104.45 the SPX hits resistance of the 20 day MA, which is approaching the 61% level, and when odds start declining the correct count is a 2nd wave up.
The SPX did make a minor lower low today, so the larger trend does remain down with 1065.25 the next previous low that would signal the trend continues downward.
Breadth for the day closed at 1.72:1, advancers, on really low volume.
7:59, The Russell breached the long-term trendline of support this morning, opening the doors for a test of the recent low at 587.67.
7:27, TNX, which tracks the yield of the 10 year treasury is getting hammered this morning, and has moved down into the most bearish part of the Fib fan (those blue lines).
Click here for a live, and updated chart!!!
7:17, The SPX remains with-in the bearish Fib fan, with upside resistance around 1080-1085.
Click here for a live, and updated chart!!!
6:49, The SPX opened gap down, and filled that open gap as expected, before reversing higher. A second wave retrace should take the SPX back up to the 1090-1100 range, with first resistance at 1087.43 from the 50 day moving average. It would not be surprising for this 2nd wave to have a smaller then normal retrace, that is less then 38%, but more then 23%.
6:45, The Trend finder moved from 100% bearish to 50% bearish.
AYCDMZVXATDE

Thursday, August 12, 2010

The Hindenburg Omen was triggered today!!!!

The Omen finally got triggered today, first, a quick refresher of what the Omen is:

It is a set of conditions, and rules that when all are met, greatly increases the odds of a large sell-off, or crash of the markets. In fact no crashes in the last 22 years have happened, that did not first have a confirmed signal of a Hindenburg Omen. Just because all the conditions have been might, and it becomes a confirmed Hindenburg Omen does not guarantee a crash, only greatly increases the chances of a severe market correction ahead. Another way to think about it is without a confirmed Hindenburg Omen in place, Bulls can sleep a little better at night knowing that most likely they will not awaken to the market down 10%. In fact the odds of a crash based upon the history since 1985 is 27% chance after two or more signals were confirmed.

The best way to think about it is under normal conditions, there can be large number of stocks, setting new 52 week highs, or a large number setting 52 week lows, but not both. Things become out of balance when large numbers of stocks are setting new highs, and lows at the same time. Having one sector soaring, and another setting new lows is not good in the balance of a healthy market.

The traditional definition of a Hindenburg Omen is that the daily number of NYSE New 52 Week Highs and the Daily number of New 52 Week Lows must both be so high as to have the lesser of the two be greater than 2.2 percent of total NYSE issues traded that day.

And that has been updated to include two more sets of conditions to filter out false readings;

1-That the daily number of NYSE new 52 Week Highs and the daily number of new 52 Week Lows must both be greater than 2.2 percent of total NYSE issues traded that day.

2-That the smaller of these numbers is greater than 75. (this is not a rule but a function of the 2.2% of the total issues) ( as of 7-12-2010, 69 issues are all that is required for the 2.2% rule!!)

3-That the NYSE 10 Week moving average is rising.

4-That the McClellan Oscillator is negative on that same day.

5-That new 52 Week Highs cannot be more than twice the new 52 Week Lows (however it is fine for new 52 Week Lows to be more than double new 52 Week Highs). This condition is absolutely mandatory.

Rules 1 and 2, are pretty much addressing the same criteria, because if you have 75 issues making new highs/lows, then mathematically, you also have achieved 2.2%. The numbers of issues fluctuates daily and it is quicker to use rule number 2. In other words, if condition 2 has been met, then condition 1 will be met by default.
The 10 week Moving Average is trending upwards, satisfying rule #3
The McClellan Oscillator is below "0", satisfying rule #4
The number of new 52 week highs today closed above 75, satisfying rules #1, and #2
The number of new 52 week lows surpassed 75 today, and closed at 76, satisfying rules #1, and #2, and since the number of new highs are not twice the number of new lows, rule #5 has been satisfied

So, now that we have all five conditions met, now what?
We have an unconfirmed Hindenburg Omen, In order to have a CONFIRMED Hindenburg Omen you must have more then one unconfirmed Hindenburg Omen, or signal, in a 36 day or less period.
Another interesting observation is that once you get two confirmed Hindenburg Omens in a 36 day period , the probability of a severe decline does not seem to increase as more Omens occur, it is possible to have multiple Omens before a crash happens. Multiple signals are telling us things are not getting better, that something continues to be out of balance in the markets.
Things are going to be very interesting now that we have a signal.
McHugh's research noted that plunges can occur as soon as the next day, or as far into the future as four months.

Wednesday, August 11, 2010

Hindenburg Omen update!!!

We are very close to a signal on the Hindenburg Omen, if you never heard of it, or want a quick refresher on the rules and conditions, please click here!!!
The 10 week MA is rising satisfying that requirement!!!
The McClellan Oscillator is below "0", fulfilling that requirement!!!
The number of new 52 week highs on the NYSE closed today at 89, above the required 75, another fulfilled requirement!!!
This is the only condition that has not been met today, the number of new 52 week lows are below the required 75, but are very close at 63.
If we have a small sell-off tomorrow and close slightly below today's close, odds are VERY good all conditions will be met, and we would have our first signal!!!!!
***Today's updates are below
*** It is 4:44, west coast time, and futures are dumping hard, down to 1075 at one point, currently at 1077.75, down 10 points from the close!!!

Sunday, August 8, 2010

The Hindenburg Omen, updated

What is it?

It is a set of conditions, and rules that when all are met, greatly increases the odds of a large sell-off, or crash of the markets. In fact no crashes in the last 22 years have happened, that did not first have a confirmed signal of a Hindenburg Omen. Just because all the conditions have been might, and it becomes a confirmed Hindenburg Omen does not guarantee a crash, only greatly increases the chances of a severe market correction ahead. Another way to think about it is without a confirmed Hindenburg Omen in place, Bulls can sleep a little better at night knowing that most likely they will not awaken to the market down 10%. In fact the odds of a crash based upon the history since 1985 is 27% chance after two or more signals were confirmed.

The best way to think about it is under normal conditions, there can be large number of stocks, setting new 52 week highs, or a large number setting 52 week lows, but not both. Things become out of balance when large numbers of stocks are setting new highs, and lows at the same time. Having one sector soaring, and another setting new lows is not good in the balance of a healthy market.

The traditional definition of a Hindenburg Omen is that the daily number of NYSE New 52 Week Highs and the Daily number of New 52 Week Lows must both be so high as to have the lesser of the two be greater than 2.2 percent of total NYSE issues traded that day.

And that has been updated to include two more sets of conditions to filter out false readings;

1-That the daily number of NYSE new 52 Week Highs and the daily number of new 52 Week Lows must both be greater than 2.2 percent of total NYSE issues traded that day.

2-That the smaller of these numbers is greater than 75. (this is not a rule but a function of the 2.2% of the total issues)

3-That the NYSE 10 Week moving average is rising.

4-That the McClellan Oscillator is negative on that same day.

5-That new 52 Week Highs cannot be more than twice the new 52 Week Lows (however it is fine for new 52 Week Lows to be more than double new 52 Week Highs). This condition is absolutely mandatory.

Rules 1 and 2, are pretty much addressing the same criteria, because if you have 75 issues making new highs/lows, then mathematically, you also have achieved 2.2%. The numbers of issues fluctuates daily and it is quicker to use rule number 2. In other words, if condition 2 has been met, then condition 1 will be met by default.

So, now that you have all five conditions met, now what?

You have an unconfirmed Hindenburg Omen, In order to have a CONFIRMED Hindenburg Omen you must have more then one unconfirmed Hindenburg Omen, or signal, in a 36 day or less period.

Another interesting observation is that once you get two confirmed Hindenburg Omens in a 36 day period , the probability of a severe decline does not seem to increase as more Omens occur, it is possible to have multiple Omens before a crash happens. Multiple signals are telling us things are not getting better, that something continues to be out of balance in the markets.

McHugh's research noted that plunges can occur as soon as the next day, or as far into the future as four months.

So where are we at now?

This is the 10 week moving average on the NYSE composite index. Currently it is rising, and fulfills requirement #3. This is a given and will continue rising for sometime, even with a sell-off it will be slow to start turning down.
This is the McClellan Oscillator, currently it is in positive territory at 25.52, above the requirement of #4. This is an indicator that needs to be check daily as it fluctuates back and forth weekly

This is the NYSE new 52 week highs, this also is a given for now, and will stay above 75 until we see some more downside. Currently reading 185 new 52 week highs after the close today, so it fills the requirement of its role in rule number 1 that new 52 week highs must be above 75.

And this is the NYSE new 52 week lows, I saved it for last because we are not near a point, without some selling pressure to worry about this one fulfilling its requirement for rules number 1 and 2. After the close today, there were 28 new 52 week lows, below the requirement of 75+, but is rising even though the SPX has been rallying, this is what happens when the market is out of balance.

So we have rules number 1 and 2, waiting for more new 52 week lows to be made. This will require a sell-off of a portion, or sector of the index to start throwing it out of balance, something that is happening now, as the 52 week lows are rising. Nothing that will happen over night.
Rule number 3, the 10 week MA is satisfied, and will stay there for awhile.
Rule number 4 needs to be checked daily, but one should not concern themselves until we start seeing more 52 week lows.
Rule number 5, can not even kick in until rules number 1 and 2 are satisfied.

Conclusion- Monday morning the stock market will not crash according to the Hindenburg Omen, we will need a small bleed-off to seeing an increase in the 52 week lows and to get the McClellan Oscillator below the "zero" line. The best thing to do for now is to keep your eyes on the weaker sectors.
As the new 52 week lows approach that 75 level I am sure it will fill the blogs with chat, and most will be aware of an approaching Hindenburg Omen before it gets confirmed. So you can sleep well for now, hehe!!
So now you know a little about what the Hindenburg Omen is, and can track it for yourself!!