 This is for Kamal, a longer term look at his Renko chart using the 12,26,9 settings for the MACD.
 This is the updated chart of the SPX, priced in Gold for the last 12 years, not a very pretty picture. The bulls can crow all they want, but in the big picture the REAL value of the SPX is not increasing. What good does a 10% move up in the SPX do, when the REAL value declines by 5%?
 9:20, The same counts as below, but in the larger picture. It is also very possible that the 4th wave could extend out in time, with the blue "C" wave becoming a larger degree wave "A
down of 4. 4th waves typically last longer then then the 2nd wave, and in this case, the 2nd lasted close to one month, so this 4th wave could easily drag on for a couple of months and not be out of the norm.
 Click here for a live, and updated chart!!!
7:31, Odds are still favoring the SPX to be tracing out the "B" wave of the 4th. 1176.91 which was the previous minor low could be a tell for the triangle, any break below here opens the door for the SPX to run down towards the 1156 level turning the triangle option 3-3-3-3-3 into a flat 3-3-5 marking the "B" wave as finished, and then working on the "C" wave down.
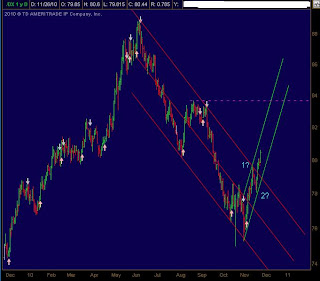
 The Dollar remains on fire, breaking above the previous low of $80.17 overnight, currently the HOD is $80.60, next spot of resistance is the previous high of $83.635.

Micheal..good analysis!!!
ReplyDeleteI do feel that USD is in for a intermediate term uptrend based on my chart here: http://runningminds.wordpress.com/2010/11/26/us-dollar-got-wings/
This might make wild card move possible in SPX!
Nice chart on your blog, I am glad to see you are also bullish on the Dollar, many posters have been bearish even as the Dollar sky-rockets.
ReplyDeleteI have free stock charts...so cannot go beyond 3 years! Can you plot $USD renko for longer term and see if all the MACD crosses were followed by intermerdiate uptrend!
ReplyDeleteAs far as being bullish or bearish....just trying hard to only read what chart says and keep my bias away. USD Bearish extreme sentiment does support the current move!
ReplyDelete