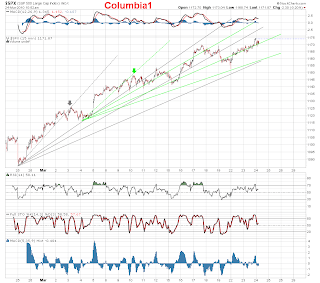
 After the close, The trend remains up, since we did not make a low, lower then 1152.88. The wave count is continuing its corrective behaviour and for now trying to figure out the squiggles is pointless, there are just too many options available and putting a micro count on just makes things even more confusing for most people. I see two main possibilities, that the 4th wave is not over and this will morph into a expanded corrective count, or this is the beginnings of the 5th wave that could be an ending diagonal, where the count is also corrective.
Breadth for the day was 1.94:1, with a definite increase in volume. This has been the theme for the last couple of months, down days have been having a much higher level of volume compared to the up days, but today, the breadth is not there to make it a really bearish day. It would of been much different if the breadth reading were above 5:1, and with that, enough to cause concern that the rally was in immediate danger of a selling off.
However, a top of some sort is approaching and being on guard for a sell-off is warranted. Breaking down below 1152.88, would be one sign that the SPX is starting to make lower lows, as would an increase in breadth and sell volume, with follow-thru.
I do not have a favorite option for a longer term count at this point, other then to say the move up from 666 was corrective, and corrective waves are hard to predict ahead of time, most EWers, including myself have been fooled too many times into thinking the rally was over and we topped, I am trying to take it one wave at a time now, and let Mr Market provide its direction first.
 Click here for a live, and updated chart!!!
9:21, The gray fib fan contunues to hold back the advances of the SPX as it acts as resistance.
 9:05, the move up for the last couple of days looks much more impulsive on the Russell, with-out all the over-lapping waves the SPX sports, also if note, very interesting how the price recaptured the old channel after the 4th wave low.
 Click here for a live, and updated chart!!!
8:08, The SPX has been creating a mess of over-lapping waves since the low back at 1152.88 that are impossible to put an accurate count on right now. In the larger picture, the most likely option would be some sort of ending pattern where corrective waves are not unusual in finishing up the final wave of a larger degree wave. As I mentioned yesterday, it would not be a surprise to have the 5th end in a truncated wave, falling way short of the 1200-1225 target for a normal sized 5th wave based on the size of the previous waves.


How are you modeling the longer term count for this to be 5 waves up?
ReplyDeleteTom, I do not have a favorite option for a longer term count at this point, other then to say the move up from 666 was corrective, and corrective waves are hard to predict ahead of time, most EWers, including myself have been fooled too many times into thinking the rally was over and we topped, I am trying to take it one wave at a time now, and let Mr Market provide its direction first :)
ReplyDeletethx for your response - enjoy the work
ReplyDeleteThe Russell and SPX both look like an ED extended 5th not yet complete. In both cases the initial advance from blue 4 appears to have been a three.
ReplyDeleteSensible work as always.