 Another chart that is in extreme over-bought territory and is up where tops are made, the Bullish percent Index.
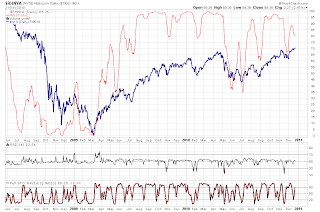
 Here is an interesting chart, the number of new highs, minus the number of new lows. There has been a steady decline in the over-all number during this rally in the equities market, a sign that not all issues are participating in the late stages, that is, waning momentum that is common at tops.
 The VIX is now down in that area were tops are made, and so far has been printing a bullish candle for this week, not a good sign for the equities market when it is making new highs, and the VIX is rising off of its lows. Just as the SPX is in extreme territories, the STO on the VIX is also at extremes and is ripe for a new bullish run. If 15.46 holds, as it looks like it might, that would be just one more of those long term divergences and a bullish double bottom.
 In my eyes this is VERY close to a nice completed structure now for a full five waves up, and we have divergences on the RSI which happens at tops. I would like to see the MACD and RSI rise just a bit more and hit that blue trendline of resistance, but otherwise this is pretty much done in terms of Elliott waves.
The STO is also now in extreme territory(94.53), the Daily chart of the SPX also has the STO up at 96.24 and the Weekly chart has it at 98.99, all three are now in extreme territory signaling that this rally is on its VERY last breath and odds for a sell-off are now very high. I was thinking that things would wait until after the start of January to start breaking down to get past the end of the year window dressing, but after todays move, I do not think it will take that long, this could start breaking down as soon as tomorrow morning. A small sell-off could turn into a large cascading sell-off now, first signs will be the STO's rolling over to a sell, and a break below today's low at 1249.43.
Breadth today was weak, at only 2.23:1 advancers, on VERY low volume, 809M shares traded on the NYSE. From the look of the tape I imagine that computers accounted for the vast majority of today's action. As always, if you are long please check those stops and keep them tight, it is useless to lose a nice chunk of profit from this rally by having no stops, or stops that are set to loose.
On the Trend Finder II the only change today was on TNX that did go bearish after yesterday's intra-day signal.


Hi there,
ReplyDeleteJust looked at your count. Few comments.
Could it be that the move up from December low is just a B wave of an expanding correction where A is the leg from early November to late November and C would push it down to 1150?
This month rally has many overlapping waves. It could be a final impulse, but even not...
In the AM scenario we would have a more complex 4th wave, big bear/bulls traps, and, finally, a top in March 2011, two years after March 2009 bottom. Does it make sense?
Thanks for sharing your analysis.
Makes sense, but either way we are topping here and starting a new bearish downtrend, it will be something to watch as it develops though.
ReplyDelete