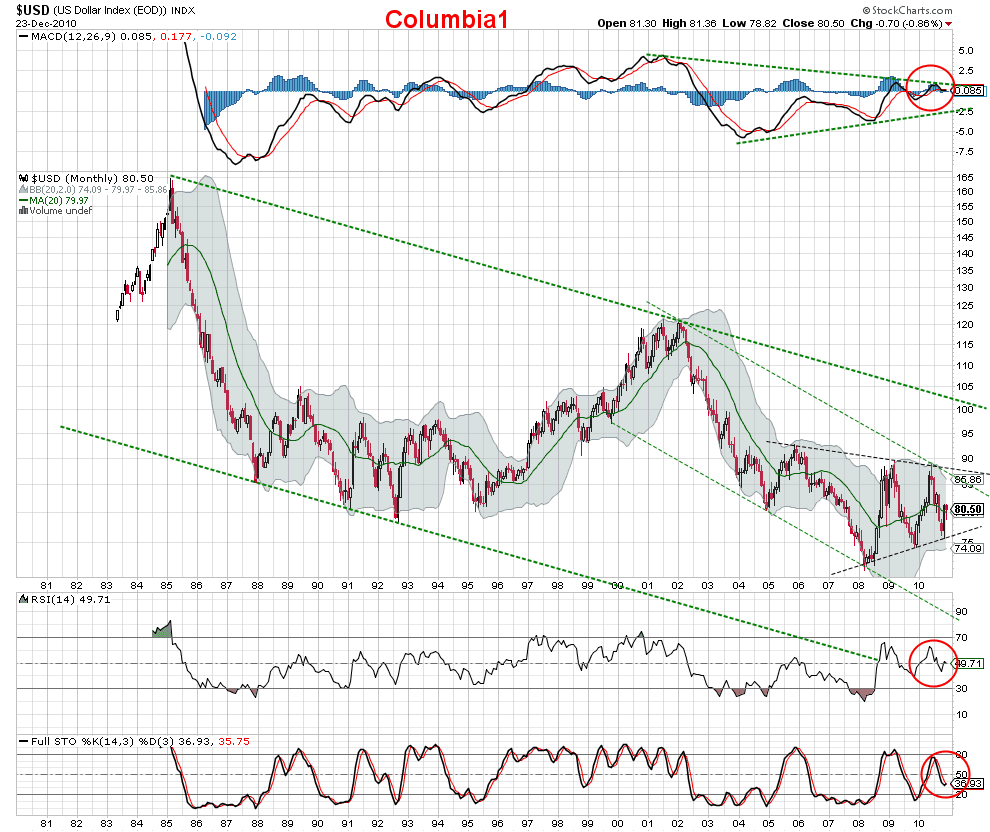
 The Monthly chart of the Dollar is slightly more Bullish then Bearish, the price action is above the 20 month MA and the STO indicator has rolled over to a buy, however the MACD and the RSI are in neutral territory, with the RSI down trending.
 The Weekly chart is is still definitely in the bullish mode with the price action above the 20 week MA, and all three indicators on a buy. It is very possible that the price could run-up to the trendline of resistance with the way the indicators are set right now, there is plenty of room, and time left before they reach over-bought territory. Comparing this weekly chart to the monthly chart up above does give the monthly a boost for the bullish scenario to further develop.
 The Daily chart is this weeks problem child, it is showing signs of being over-bought at this time with the RSI down trending, and the STO close to entering extreme over-bought territory suggesting a pull-back with-in the next week. This would fit in as a larger correction and possible part of an on-going "B" wave that started at the beginning of December, with the run-up from the bottom as an "A" wave. There is a possibility that this could be a 4th wave, but it is an option that bends some of the rules because the move up from the bottom at $75.63 to the beginning of December at $81.44 is a clear-cut three wave move. What this chart does not show, is the flash crash back on 10-22, that made a lower low at $74.965, with this low an argument can be made for a 4th wave. FWIW, Think-or-Swim does still show the flash crash in their charts.
Using the top three charts as a guide for direction, I still believe that the green option shown above still has the lowest odds and both the red and blue options running even. There is clearly enough room in the Technicals to run-up and test the upper trend line around the $86 level, it is the move that follows that will make the most important difference, will it correct down quickly enough to re-set the indicators to over-sold condition so that a break-out to the upside can be accomplished(red option), or will the $86 level hold and the price runs down to test the lower trendline that will ultimately break giving way for a collapsing Dollar and upping the odds of a hyper-inflationary scenario (blue option).
 Bonus chart, The Fib fans on the Dollar are mixed with the price in the weakest part of both fans, but the price action is respecting the latest set of bullish fans better then the bearish set. There will be a big test coming up around $81.50 when the last blue, bearish fan of resistance comes into play, this is a must break-thru for the blue and red options to play out.
 Bonus chart, The Fib fans on the Dollar are mixed with the price in the weakest part of both fans, but the price action is respecting the latest set of bullish fans better then the bearish set. There will be a big test coming up around $81.50 when the last blue, bearish fan of resistance comes into play, this is a must break-thru for the blue and red options to play out.
The Trend Finder II is updated for both the Daily, and the Weekly, there have been a few changes this week!!!


No comments:
Post a Comment