
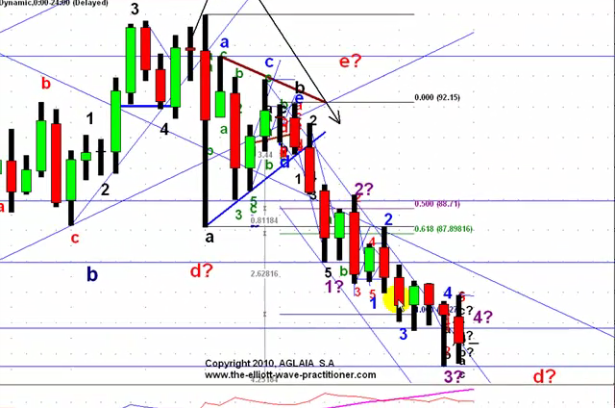
Roy has a short update on the USD/JPY to share with us,
Click here to view the clip!!!
The VIX went from one extreme to the next in the Bollinger Bands, and is now below the two standard deviation range, and is also close to testing the lower trendline of support after breaking below the 200 day Moving Average. The VIX is due for a reversal here very soon, which would be bearish for the equities markets.

The Summation Index on Friday printed another black bar, this time the distance dramatically increased from the previous days distance, a sign that the Index is accelerating to the upside and is not in a consolidation pattern that when finished would have resumed back in the original bearish direction, bullish!!!

The percent of stocks that are above their 50 day moving average is still climbing into over-bought conditions, but is far from the extreme readings where tops are formed(90+%). With the price action now above the 20 day MA this chart is now showing bullish signals and will continue doing so until the 20 day MA crosses the price action.

The SPX has one chance here to follow the alternative count (gray), it must respect the trendline from the top and enter into a bearish sell-off very early next week, other-wise the primary count will have the SPX break-above that trendline opening the door for a test of the previous high at 1131.
 Roy has a short update on the USD/JPY to share with us, Click here to view the clip!!!
 The VIX went from one extreme to the next in the Bollinger Bands, and is now below the two standard deviation range, and is also close to testing the lower trendline of support after breaking below the 200 day Moving Average. The VIX is due for a reversal here very soon, which would be bearish for the equities markets.
 The Summation Index on Friday printed another black bar, this time the distance dramatically increased from the previous days distance, a sign that the Index is accelerating to the upside and is not in a consolidation pattern that when finished would have resumed back in the original bearish direction, bullish!!!
 The percent of stocks that are above their 50 day moving average is still climbing into over-bought conditions, but is far from the extreme readings where tops are formed(90+%). With the price action now above the 20 day MA this chart is now showing bullish signals and will continue doing so until the 20 day MA crosses the price action.
 The SPX has one chance here to follow the alternative count (gray), it must respect the trendline from the top and enter into a bearish sell-off very early next week, other-wise the primary count will have the SPX break-above that trendline opening the door for a test of the previous high at 1131.

just getting started :) http://frxsmtraders.blogspot.com/
ReplyDelete