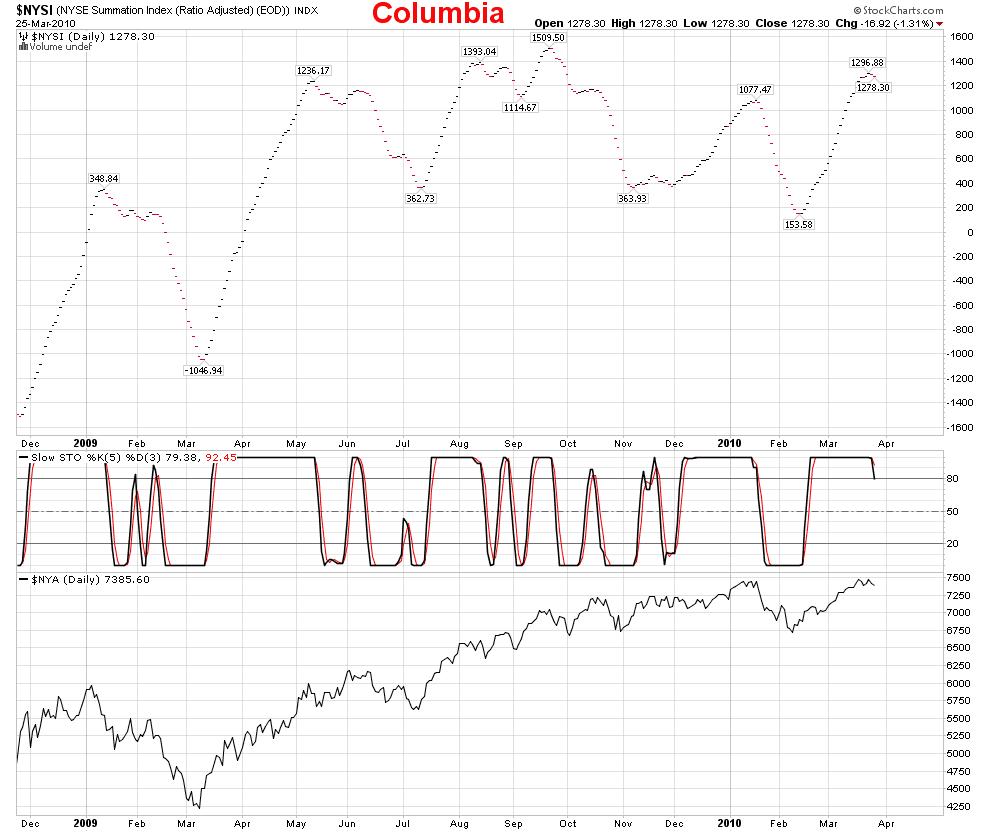
 This is another chart that is not bull friendly, the SI looks to be rolling over to a sell.
 We are at extremes on this chart, and another reason that a top is very close at hand.
 The SPX is very close to losing support from the shorter-term bullish Fib fans after this afternoons sell-off.
 After the close, A strange today, making a new higher high, and yet we closed in the red, and down below yesterdays low of 1166.01. That is enough to put the uptrend in jeopardy by making a lower low, although it was only a minor low it was a shot over the bow that this rally is losing stream and is very fragile now. So for now I am putting the trend to neutral until we either make a higher high above 1180.69, or until the low of 1152.88 is broken.
The count for the SPX is still out of whack with a persistence of over-lapping corrective waves making a high probable count difficult, now is a good time to be on guard for a sell-off as it has been common for the 5th wave of these rallies to end short, or truncate. FWIW, I lightened my longs on WSS near the high this morning high.
Breadth for the day is one saving grace for the bulls, only 1.43:1, decliners on slightly increased volume, this is not bearish in my mind, and until we have follow-thru with larger numbers the bulls still have the ball.
The indicators are really starting to show divergences now, another sign a top is very close at hand and with the sell-off this afternoon, the McClellan Oscillator will most likely be in negative territory when Stockcharts gets their daily charts updated.
 7:39, The Dollar has now broke up and away from any influence of the bearish Fib fans, and at the same time cleared a big chunk of resistance from last years sell-off, this morning making a higher high at 82.06. I posted a count yesterday on the Dollar, with the 1-2-3-4 count completed, and now in the 5th. There is an optional count, and this chart supports that, a 1-2, 1-2, up!!!
 Click here for a live, and updated chart!!!
7:27, The gray fib fans on the daily chart of the SPX continue to be respected, and the one is acting as resistance with the SPX sliding along the line, but without breaking through to the upside.
 Click here for a live, and updated chart!!!
7:07, The SPX continues to print out over-lapping corrective style waves in what could either be the final wave up in the 5th, or possible the 4th wave is not over and this mess is part of a larger expanding triangle. The upside targets are in the 1200-1225 neighborhood, but with all the truncated 5th waves we have had since 666 during this bear market rally it would not be a large surprise that this one too will fail to reach its full potential.
 Click here for an updated real time chart!!!
6:58, The trend remains up, as we made another higher high this morning in a large gap up open. I added a third set of bullish Fib fans from the 1152.88 low now that I have enough price data to construct a new fan.


Confusing pattern. However looking at what's happening in FTSE and Hong Kong, I'll guess that the extended fifth ED still applies. Possibility that blue 4 to green 5 is wave 'A', as that would fit with the exact same pattern for FTSE. FTSE has 5800 = 1.618, now trading at 5718 so there is plenty of room for B, C, D and E and for that to be replicated in SPX.
ReplyDelete