 This is my prefered count on the SPX, and it is quite possible that the trend from July has came to an end. My optional count could make a higher high, to complete this wave and is from Binve's Prefered that can be count found here:
There is No Better Breakfast than Pumpkin Pie and Midnight Black Coffee, from Binve's blog, Market Thoughts and Analysis
 This is the more bearish looking Russell and if this count is valid, should be tipping its had very soon now. One very interesting thing on this chart is the MACD, which has came back down and hit support, it needs to break through for this count to continue
 We are now at 54.6% of the stocks above their 50 day MA now. This chart has been showing negative divergence for the last two and a half months and has yet to get close in this sell-off to the levels that we saw back at the beginning of the month, after the last sell-off.
 The McClellan Oscillator has trended below zero, into sell territory, but not with much conviction.
 This is the Bullish Percent Index for the SPX. And already has made a lower low and trending to the downside. It also has fulfilled the required 6% retrace for the first part of the sell signal, but still needs to break below 70% for full confirmation.
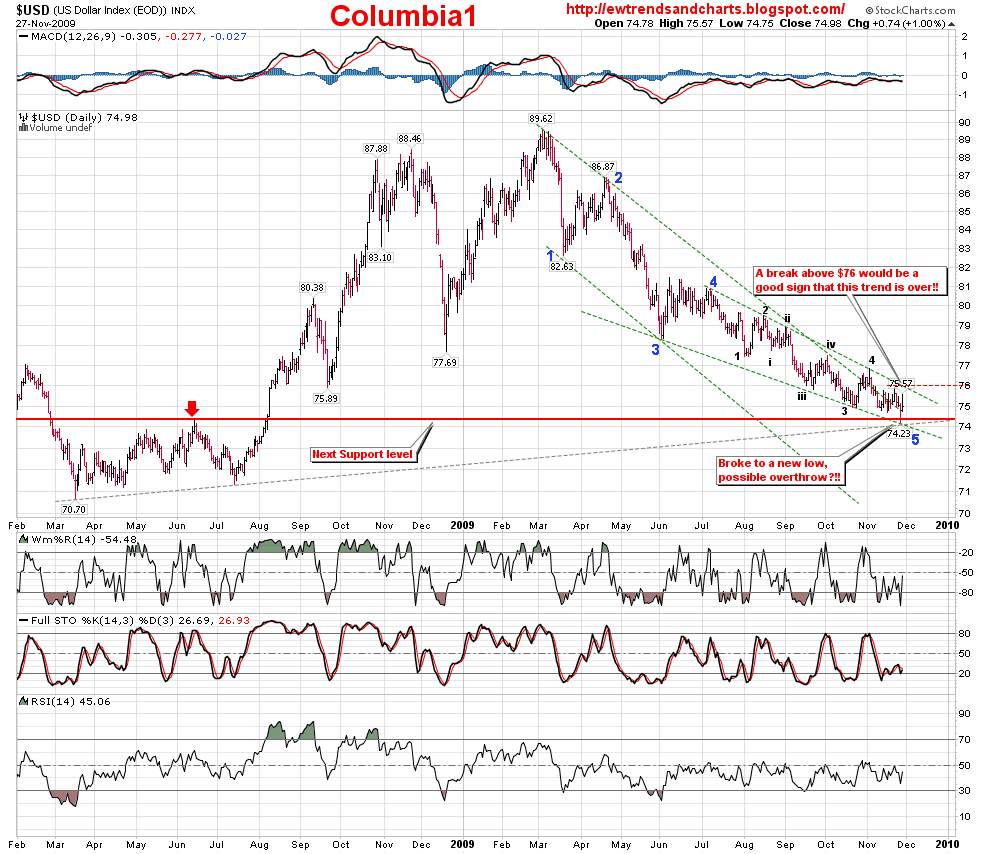 The Dollar chart, this is what it all comes down too, did the Dollar bottom last week at $74.23, with an ending diagonal and a throw-over, or is there still one more minor wave down. I would like to see the Dollar trading above $76, which would be making a higher high, to have a little more confidence in this count. I would expect to see a large jump here if the sell-off is completed, reversals off of bottoms are unusually sharp and quick. The Technicals also suggest that the Dollar is still oversold at this time.
 This is the Daily chart of the SPX, and the 20 day MA is still acting as support, but in over-bought conditions
 And the Russell, which is leading the SPX, has already had a death cross and the 20 day MA is resistance.
  The VIX, almost as important as the Dollar chart, did manage to close above the channel after a break away gap last week. The bears need the VIX to stay out of the old channel and start developing a new upwards pointing channel and ultimately breaking above $31.84.
In summarization, the market is weak, and at a turning point now. If we have any more downside things would get bearish much faster. I also believe that we might have a little more upside, but not enough to make new highs. Monday and Tuesday will be very telling, we should start to see some higher volumes now the holiday week is over and people start to position themselves for the end of the year.
-Please read Saturday's post, Follow the Leader? for more on the weaknesses of the markets!!


I kind of have a simple wave count going for the Russell 2000. The Russell 2000 appears to be tracing out 5 waves down from the top on October 19. This chart shows the bottom of wave (1) that began on October 19, and top of wave (2) (the high on November 23). The rally that began on November 2 was a complex countertrend pattern. The first part of the countertrend was an ABC zigzag followed by a three wave move to the X low on November 13. The second part of the countertrend move traced out a triangle marked by ABCDE. You can see the labeled chart along with some other markets here: http://www.graspthemarket.com/elliottwave/20091130a.php
ReplyDelete