 The McCellen Oscillator is showing a buy signal (below 50)!!
 Todays count with the finish of wave i of 3 down, then starting ii of 3 near the close fits really nice in this picture, I was expecting a bounce on the trendline of support, before breaking through. The bearish option would be in the perfect count to do so after a brief correction to the upside, then into iii of 3 down!!
 We had a full five minor waves down today, completing either wave i of 3 Bearish, or for the Bullish option, completing wave C of a corrective sell-off. Decliners beat out Advancers 3.25:1, on strong sell volume. I expect to see some upside tomorrow, for wave ii of 3, 1075, is 50%, and 1081 is 61.8% retracement. Any levels above 1081 should really alarm the Bears!!!
118 new 52 week highs, and 8 new 52 week lows.
Mark wrote a very nice blog this morning, Calling the Top.......Who cares? Why you should.
Please recommend this, so we can get Mark blogging more!!
 I am watching this Renko chart for clues to see if we are indeed in wave 3 down, or in a corrective sell-off. The RSI is a great tool for finding 3rd waves and should bury itself if that is what is happening. The other option would be a break of the trendline of resistance on the RSI to the upside, that would make me lean more to the option of a corrective action. The MACD is also a good tell, as long as it keeps showing a sell signal and does not cross the most likely option is the bearish wave 3 down.
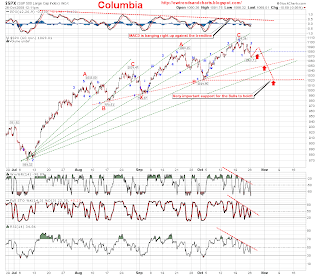 SPX is right on the trendline, if the past provides any clues, it would be that a bounce would take place first, before breaking the trendline. I see two different possible outcomes, a 1-2 down(bearish), or a corrective a-b-c down, before another attempt to establish a new high (bullish). The vix is rallying today, and has trendline resistance around 27, currently at 24.28.


Cool charts Col! I enjoy your use of Renko. Favour the Summation Index over the Oscillator but my time frame might be different from yours, its all about style. Cheers!
ReplyDelete